Solder paste inspection (SPI) measures the printed paste before component placement, helping identify missing, insufficient, excessive or misplaced deposits. To make a useful decision, read volume, height, area and offset together, check the inspection recipe, and investigate the pattern of abnormal results.
A volume percentage alone won’t tell you whether the print is usable. You need to know its reference value, where the paste landed, and what geometry the stencil was intended to create. Even an acceptable print still needs placement, reflow and later verification.
Here’s how to turn those readings into a focused review without guessing at a universal tolerance or adjusting settings just to silence alarms.
Inspect the print while correction is still practical
The usual SMT sequence is stencil printing, SPI, component placement, reflow, then inspection and testing of the assembly. SPI observes the paste on the side being printed before components are placed on that side.
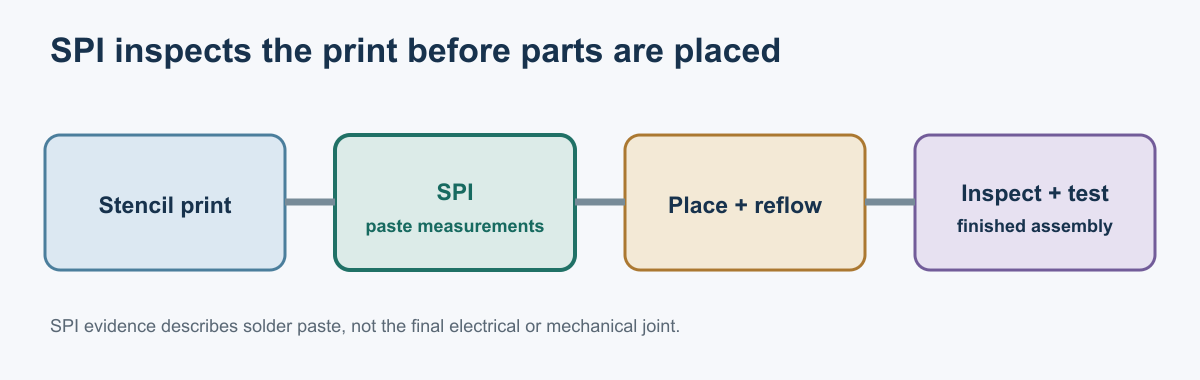
Illustration: This conceptual flow locates the paste checkpoint. It does not depict a particular production line or FLJPCB procedure.
At this point, a suspected misprint can be contained before placement obscures the deposits. The board may be eligible for cleaning and reprinting under a qualified procedure. Eligibility depends on the board’s condition and assembly state; a second-side print may already have components on the opposite side.
Keep the correction method controlled. Smearing paste across a pad or adding a little by eye changes the deposit without establishing that its geometry or condition is acceptable. Use the approved recovery method and reinspect the resulting print before releasing it.
The observation also has a time boundary. SPI describes the paste as measured at that checkpoint. Handling or delays after inspection may change its condition. Retain the connection between the inspected print and the board that proceeds to placement.
The broader PCB assembly defects guide covers failures across the assembly route. This checkpoint gives the process team evidence specifically about the print.
Read volume, height, area and offset together
An SPI report describes the printed deposit from several angles: how much paste is there, how tall it is, how much surface it covers, and where it landed. Read those measurements together to understand why a deposit was flagged.
Two-dimensional inspection assesses the surface image, including area and alignment. Three-dimensional SPI measures height and derives volume as well. Koh Young’s explanation of SPI describes these measurement categories.
Know what the percentage is comparing
Start with the report’s reference value. A percentage may compare measured paste volume with the stencil aperture’s theoretical volume, or with a programmed nominal value. Those are different denominators. Confirm what the recipe uses before interpreting the number.
Transfer efficiency is measured deposit volume divided by stencil aperture volume, as described in Indium’s print-metrics guidance.
Here’s a hypothetical calculation for a rectangular aperture:
- Aperture opening: 0.30 mm by 0.50 mm.
- Stencil thickness: 0.10 mm.
- Theoretical aperture volume: 0.30 × 0.50 × 0.10 = 0.015 mm³.
- Measured paste volume: 0.012 mm³.
- Transfer efficiency: 0.012 ÷ 0.015 × 100 = 80%.
These values demonstrate the arithmetic. They are not recommended aperture dimensions or an acceptance limit. If the inspection program uses a different nominal volume, its displayed percentage will change even though the measured deposit is the same.
| Measurement | What it describes | Useful companion check |
|---|---|---|
| Volume | Estimated amount of paste | Height and footprint |
| Height | Vertical profile | Reference surface and area |
| Area | Surface footprint | Position and volume |
| Offset | Position relative to the target | Overlap and neighboring deposits |
Look for agreement between the measurements
Volume can look normal while offset is wrong: the deposit has the expected amount of paste but sits too far to one side. Area can look normal while volume is low if the deposit covers a broad footprint but remains thin. A single green value won’t explain either situation.
Look at the actual location and neighboring deposits. Paste spreading toward an adjacent fine-pitch pad raises a different concern from a slightly irregular outline on an isolated pad. Likewise, a missing deposit deserves a different review from an uneven deposit that still occupies the intended region.
Compare equivalent apertures across prints, too. Indium’s discussion emphasizes consistency alongside average transfer efficiency. A board average can conceal one repeatedly abnormal deposit or a large spread between otherwise comparable locations.
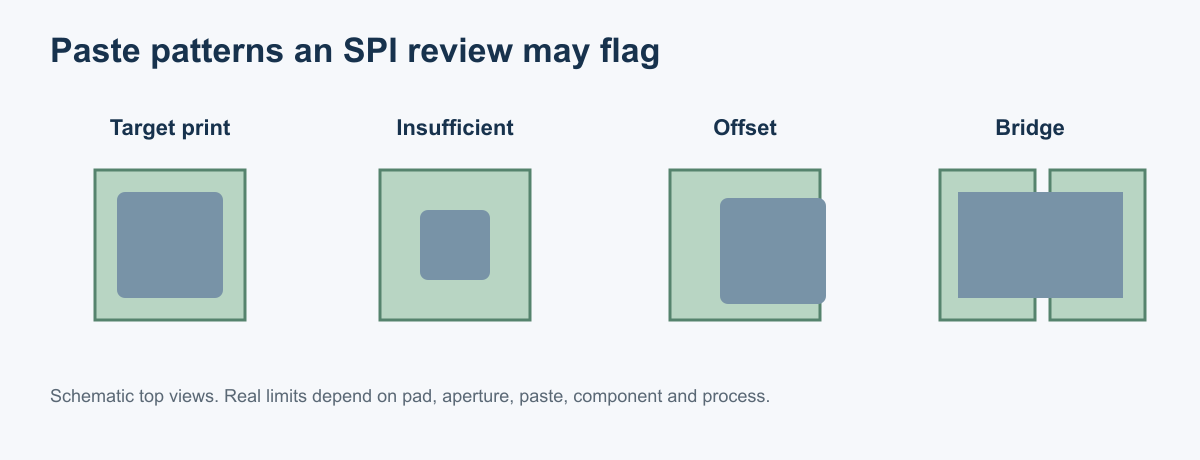
Illustration: The four top views show patterns that merit review. Shapes are schematic and do not define dimensional tolerances or pass/fail limits.
Treat split thermal-pad deposits as intentional geometry
A large thermal pad may use several smaller stencil openings. Analog Devices’ LFCSP assembly guidance recommends this approach for thermal paddles and calls for process development because assembly processes vary.
The empty spaces between deliberate paste windows therefore aren’t automatically missing print. Compare the SPI map with the approved aperture pattern. A program expecting one solid deposit may mischaracterize the intentionally separated windows.
Check the individual windows as well as any grouped result. An acceptable total can hide an underprinted window balanced by extra paste elsewhere. The inspection objects and their limits need to preserve the information that matters to the approved pattern.
Use the pattern to narrow the investigation
Before changing the printer, establish what repeats: a location, a package, a panel region, or a point in time. An SPI alarm identifies a measurement that needs attention. Its distribution helps you decide where to investigate first.
Indium’s Solder Printing Basics lists interacting variables such as aperture design, stencil condition, support, cleaning, print settings, material and environment. Use those categories to organize a review rather than treating one red flag as proof of a specific cause.
A recurring low deposit at one location
If one pad stays low while neighboring pads remain steady, inspect that feature and its history. Compare the same position on consecutive boards. On a panel, compare equivalent positions in the other board cavities. A problem following one physical aperture suggests a different investigation from one following every instance of a particular aperture shape.
Check whether the deposit is physically incomplete or displaced from the measurement region. Inspect the relevant aperture and local stencil-to-board contact. Look for corroborating evidence before declaring the aperture blocked or changing the stencil.
Consider a hypothetical fine-pitch row with one repeatedly low location. If its counterpart in another panel cavity prints consistently, a shared package definition alone doesn’t explain the difference. Review the local aperture and contact conditions. If all matching locations behave similarly, compare their common geometry and print setup. These are ways to narrow the investigation, not conclusions about the cause.
A shift across a region or the whole board
A coordinated positional shift across many pads deserves a registration review. Check the physical deposits against the PCB pads and compare that view with the inspection overlay. If the overlay is wrong, compensating the printer could move a physically correct print away from its intended position.
For a shift confined to one region, examine how the board or panel is supported and clamped. Compare that area with regions printing consistently. On a second-side print, the support arrangement must also account for already mounted components; a fixture change deserves attention when the onset follows it.
Keep a widespread volume change separate from a positional change. Increasing paste transfer won’t correct a registration error. Identify the observed symptom first, then select the process variable or measurement setup that could plausibly explain it.
A change after a pause, wipe or material change
Use the event history. Did the pattern begin after a line interruption, underside wipe, paste replenishment, setup adjustment, or material change? Compare the first prints after that event with the preceding stable sequence and with subsequent prints.
Indium’s response-to-pause discussion shows that paste-volume response after a pause can depend on formulation. A pause is a useful clue, but it doesn’t create a universal rule to reject every first board.
Review the actual paste identity and handling history. Indium’s handling and storage guidance explains how condition can affect paste roll and aperture fill. Apply the instructions for the material in use rather than borrowing a storage temperature or working-life limit from another paste.
Once you have a plausible explanation, verify it with a controlled change and compare the same feature set. If several variables change together, an improved print won’t show which change mattered. Record what was observed, what was adjusted, and what the follow-up measurements established. Keep an unverified explanation labeled as a hypothesis.
Build limits around the feature and verify the calls
A useful threshold starts with a trustworthy measurement recipe. Check what the system is measuring and how it compares the result before deciding whether a borderline deposit is acceptable. Widening an alarm band can reduce calls while leaving the print unchanged.
Validate the measurement recipe first
Confirm the board revision, panel layout, stencil, print side and inspection program. Compare its expected deposit geometry with the released aperture design. A stencil change can alter the intended volume even when the PCB pads haven’t moved.
Have a trained reviewer check registration, the measurement overlay and the height reference. Follow the equipment manufacturer’s verification procedure. If repeatability is in question, use repeat scans under that procedure to evaluate the measurement. Scanning again doesn’t improve the physical deposit, and selecting the most favorable result hides the uncertainty.
Review representative small apertures, fine-pitch rows and thermal-pad patterns separately. A recipe can appear reasonable on large deposits while handling a different feature poorly. Preserve examples of accepted, rejected and borderline conditions with the reasoning used to classify them.
Standards address different parts of the problem. The public IPC-7527 sample describes visual print acceptability and process evaluation; it explicitly notes that volume isn’t visually inspectable. J-STD-005B’s table of contents concerns solder-paste material requirements. Use the contractually selected documents and revisions. These scope descriptions alone don’t establish numeric SPI limits for a particular assembly.
Separate acceptance limits from process-control signals
Acceptance criteria describe the condition permitted for the product. Statistical process-control limits describe expected process behavior based on an established data set. A deposit can satisfy its acceptance criterion while a trend signals a change that deserves investigation.
In an October 2026 discussion of SPI process analysis, Koh Young applications engineer Ray Welch describes how average volume can shift while deposits still pass. That’s a reason to review the measurements over time rather than rely only on the reject count.
Build acceptance limits around the feature’s intended print and its role in the assembly. Evaluate representative prints against downstream results during process qualification. Treat the selected limits as controlled settings, with an owner and a documented evaluation basis.
Avoid pooling unrelated deposit geometries into one trend. A change in the mix of inspected pad sizes can change a board-level average even when each feature group behaves consistently. Keep the population and reporting basis stable when comparing runs.
Make every alarm end in a reasoned disposition
For a confirmed misprint, use the qualified cleaning and reprint procedure if the board is eligible. For a false call, record the evidence and have an authorized person correct the inspection setup. If the evidence is inconclusive, hold the affected board for engineering review.
Changing the product acceptance criterion needs its own approval basis. It shouldn’t happen automatically because the inspection setup produced nuisance calls. Separate correcting how a feature is measured from deciding that a different physical condition is acceptable.
Preserve the original result, image, decision and reason. After a process correction, verify subsequent prints on the same relevant features. After a recipe correction, confirm that it classifies both acceptable and unacceptable examples appropriately.
Track confirmed defects, false calls and unresolved reviews separately. Also retain repeat-print and reinspection history. Otherwise, a falling alarm count may describe a changed program or repeated screening rather than an improved printing process.
Carry the evidence through placement and reflow
A later defect is easier to investigate when its inspection records point to the same assembly. Keep enough location and configuration information to connect a paste deposit with the component and joint it was intended to support.
Investigate a later defect with the same board identity
Match the physical board, panel cavity, side and footprint before comparing SPI with placement, reflow or final inspection. Check the board revision and measurement time. A lot average may obscure a local concern; a result from another cavity may describe a different physical deposit.
A passing SPI result describes the measured print within the configured criteria. If a hidden joint fails later, review the original measurements for the affected pads and confirm that those features were inspected. The print may have met its criteria, an issue may have escaped the programmed checks, or the defect may have developed during placement or reflow.
Keep the possibility of multiple contributing conditions open. A low deposit followed by an open joint makes printing worth investigating, but the pairing alone doesn’t exclude placement, surface condition or thermal-process contributions. Use additional evidence to test the explanation.
Match the inspection method to the question
Post-reflow AOI assesses visible assembly features. X-ray provides evidence about hidden joint geometry, including BGA joints. Electrical and functional tests check selected electrical conditions and product behavior. Each method has a defined coverage boundary.
For a suspected hidden BGA joint, compare the SPI map with the X-ray result for that board and location. The BGA X-ray inspection guide explains what the image can reveal and where its interpretation remains limited.
If the concern is an electrical open or a failed product function, use the appropriate test evidence. A geometric observation doesn’t establish circuit operation. The ICT, flying-probe and functional-testing comparison describes those differences.
Choose the next investigation from the unanswered question: paste transfer, joint geometry, electrical connection or powered behavior. That keeps a passing result at one stage from being used to answer a question it never measured.