


When we analyze procurement costs using a procurement cost index and by looking at related commodity prices, the main goal is to see, at the company level, whether changes in PCBA (parts and materials supplied) procurement cost make the company more competitive in the external market or less competitive. From inside the company, changes in purchase unit price and in purchase quantity can both change procurement cost. How do we tell which factor matters more? Below, Zhongyan Electronics explains this.
1. Controllable Factors
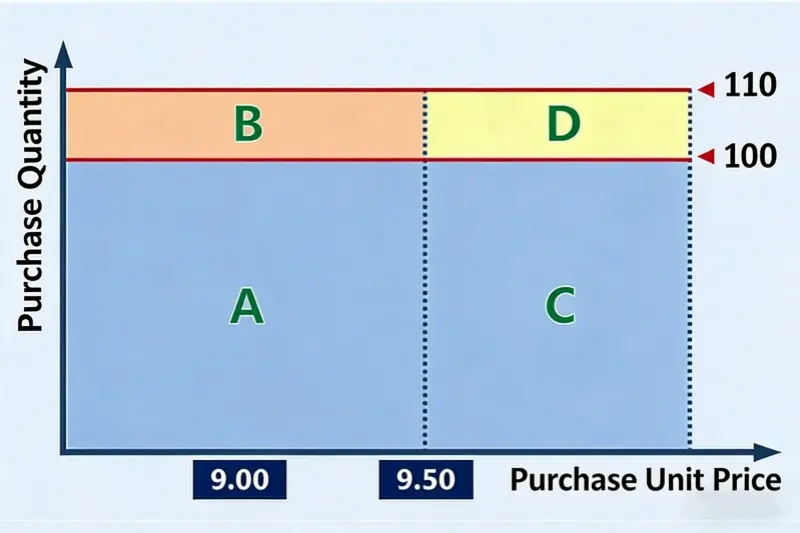
We start with a simple example. There is a material A. Last year its purchase price was $1.30 per unit. This year it rose to $1.37 per unit. Last year we bought 100 units. This year we will buy 110 units. See the picture below.
From the picture, the area labeled A equals last year’s purchase amount of $129.56 (= $1.30 × 100). The whole area A+B+C+D equals this year’s purchase amount of $150.43 (= $1.37 × 110). In other words, the extra procurement cost this year compared with last year is the part B + C + D, which is $20.87. Clearly, part B equals $12.96 (= $1.30 × [110 − 100]). That part comes from the change in purchase quantity. Part C equals $7.20 (= [$1.37 − $1.30] × 100). That part comes from the change in purchase unit price. The problem is part D. This $0.72 (= [$1.37 − $1.30] × [110 − 100]) of cost increase — should we count it as caused by unit price change or by quantity change? Both ways seem to make sense.
Here we need a common attribution rule used in management data analysis: attribute to the controllable factor.
A company’s “controllable factors” are those that you can more easily change by your own efforts. That means, if you make the same effort to change two factors, the factor that produces the larger effect is the company’s “controllable factor.” Controllability is relative.
When you analyze how different factors cause a result, sometimes one result can be explained by two or more factors and each explanation looks reasonable. If you must pick one factor, choose the factor that is more controllable by you. Why pick this? Because the point of management data analysis is to act on the results to get better business outcomes. If you enlarge the role of the controllable factor, you point to the action that gives the largest return on your effort. That gives a clearer direction for management to act.
2. Quantity-Price Allocation
For most companies, the amount of materials used in PCBA work is mainly linked to production volume. To change usage, you normally need design changes or process improvements. That is hard. Compared with changing quantity, a company can usually do more to affect the purchase price. So, relative to quantity, purchase unit price is the more “controllable factor.” Therefore, the D part in the picture is usually assigned to the purchase price effect. Of course, some companies can control quantity better than price. In that case, use the real situation for that company.
Can we split D evenly between “quantity” and “unit price”? We usually do not do that. Management data analysis is not the same as scientific analysis. Management analysis does not pursue perfect precision. It does not need perfect fairness either. The goal is usefulness. The goal is to give management a clear direction. If a simple method gives a clear direction, it is better than a more complex method that is only slightly more precise.
If we split D in half, the result may look more precise or more fair. But that also makes the algorithm more complex and harder to understand. It does not give a better direction for management action. In other words, that extra precision is not useful.
Back to the chosen quantity-price allocation method for purchase cost change. In table form, it looks like this:
Key Definitions
- LQ: Last Quantity (previous period purchase quantity)
- CQ: Current Quantity (current period purchase quantity)
- LP: Last Price (previous period purchase unit price)
- CP: Current Price (current period purchase unit price)
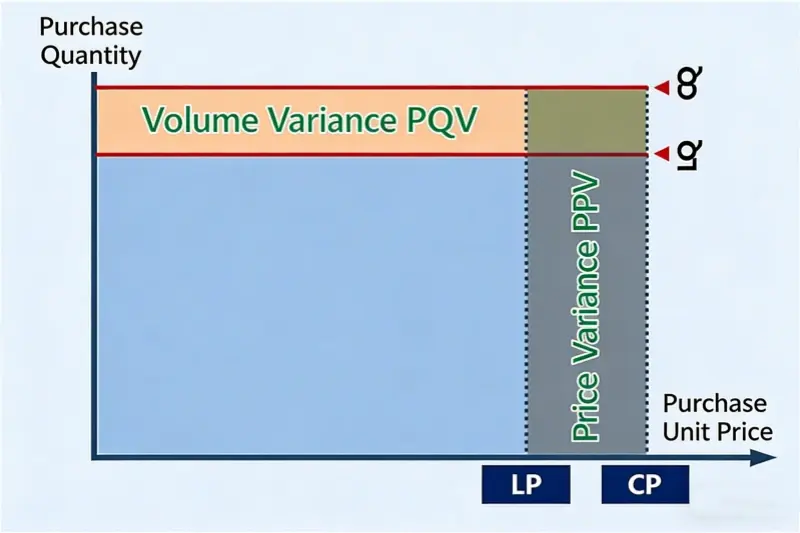
- PQV: Purchasing Quantity Variance
- PPV: Purchasing Price Variance
Quantity-Price Analysis Template for Procurement Cost Change
Key Formulas
- Quantity variance (PQV) = Current Price (CP) × (Current Quantity (CQ) − Last Quantity (LQ))
- Price variance (PPV) = (Current Price (CP) − Last Price (LP)) × Current Quantity (CQ)
Using the example data in the template, this material’s procurement cost this year falls by 3.3% compared with last year. The change in purchase quantity caused a 2.6% increase in procurement cost, while the change in purchase price caused a 5.9% decrease in procurement cost. For single items, the percent decrease in procurement cost due to price changes lies between 2.9% and 9.1%.
Using this template makes it simple to do quarterly or yearly quantity-price attribution analysis for procurement cost change. The template can also clearly show, from either the quantity side or the price side, which materials should be the next focus. For the supply side, especially for the purchasing department, more effort is needed on the price side.
3. Summary
Above we described how to allocate and analyze quantity and price when total procurement cost changes. We also described a common attribution principle in management data analysis: attribute to the controllable factor. We stressed that the main goal of management analysis is to give action directions for business management, not to be as precise as possible. Usefulness is the most important thing.
When learning an analysis tool, more important than knowing how to use it is understanding the analysis method behind it. The real value lies not in the tool itself but in the ability to use the tool well.

